When forecasting the next 50 years, we see India and China leading the world economy with significant contributions to the world population and world income. According to the latest World Bank report, “Global Economic Perspectives” India will become the fastest growing developing country in the next two years and predicts it will grow at 7.9% by 2018, while China will grow at 6.5% (Sudgen, 2016). According to PWC’s latest report, “World in 2050”, by 2050, the two economies will hold one-third of the world’s income; China’s share of world GDP in PPP terms will be 19.5%, about $61 trillion, while India will claim second place at $42 trillion (Fensom, 2015). Whoever the next economic superpower will be, with the emergence of globalization and rapid changes in technology and society, India and China present both opportunities and challenges to the global economy. One of the major threats to society from globalization and emerging market rapid growth is climate change. In this paper, I have analyzed energy consumption and carbon dioxide emissions to measure climate change and the negative environmental impacts that result from the economic growth of India and China.
Figure 1 below shows a strong positive correlation between GDP and energy consumption; as ln(GDP) increases, ln(E/energy consumption) also increases. In Figure 1, it can be seen that India and China, are right alongside US and Japan in terms of energy consumption with China closer to U.S. and India closer to Japan. A positive correlation between GDP and energy consumption is expected;, economic growth increases household and commercial demand for energy.
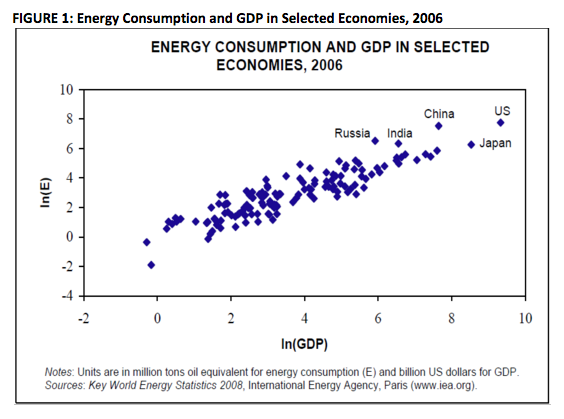
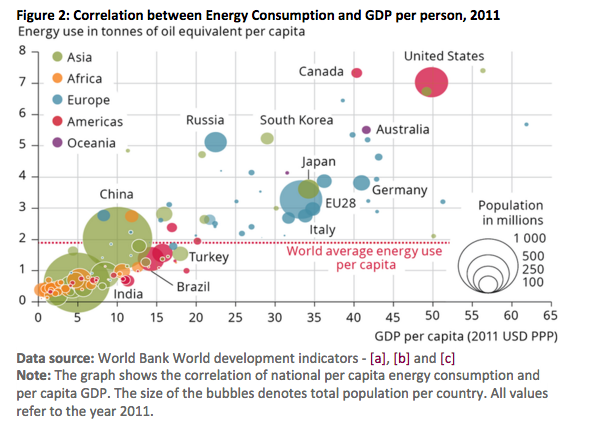
Figure 2 (EEA, 2015) below shows a strong correlation between per capita energy use and per capita economic output. However we see developed countries are higher up per capita energy consumption/GDP curve, whereas developing countries, such as India and China, despite their absolute economic size, remain lower on the per capita energy consumption/GDP curve. The data continues to show current advanced economies remain resource intensive and a strong correlation between economic growth and energy consumption. With developing countries growing at such rapid rates, if their consumption and production patterns mimic those of developed nations, this would mean that the per capita energy consumption would rise significantly with significant repercussions for global resource demand.
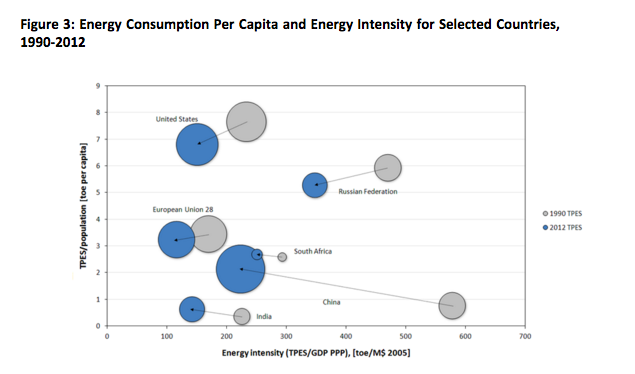
The trends in energy consumption in the last twenty years is explored further in Figure 3 (IEA, 2014). Here the energy intensity and energy consumption per capita trends of selected countries between 1990 and 2012 are mixed depending on the stage of economic development. Energy intensity measures the amount of energy (Total Primary Energy Supply, or TPES, in tonnes of oil equivalent, or toe) a country needs to generate a unit of gross domestic product (GDP), while energy consumption per capita represents TPES divided by the population of the country.
Most notable is the fact that energy intensity has declined across most countries in the past two decades. This is due to several factors – high improvements in energy efficiency, innovation in technology, structural changes in the economy of the developed economies. However, this figure below also highlights the differences in energy consumption per capita between the developed and developing countries. As developing countries, opened up their markets in the early 90s, this increased the demand and consumption of energy per capita. However, the developed regions such as the US and EU transitioned into the services industry from the manufacturing industry, their energy consumption per capita reduced in these 22 years.
The amount of greenhouse gas emissions discharged into the atmosphere remains an area of concern. There is broad consensus in the scientific community that a rise in CO2 emissions leads to a rise in the global temperature. Figure 4 (IEA, 2015) below shows that most global CO2 contributions come from a few selected countries; China, the U.S., India, Russia, EU. According to the U.S. Energy Information Administration (EIA, 2015), China ranks first in terms of total CO2 emissions with 8106 million metric tons, the U.S ranks second at 5270 million metric tons and India ranks third with contributions of 1831 million metric tons of CO2 emissions. Between 1990 and 2014, total emissions increased almost three-times in China and two-and-a-half times in India. But China’s per-capita emissions in 2014, at 6.2 tonnes, matched the level of the European Union. India’s per-capita emissions were 1.6 tonnes in 2014, or about 10% of the level in the United States. However, on the positive side, the CO2 intensity, i.e. CO2 emissions per unit of economic output declined in all global regions. China emitted 0.82 tonnes of CO2 per thousand US dollars of economic output in 2014, which compares with rates of 0.3 tonnes in the United States and 0.18 tonnes in the European Union. This can be attributed to huge improvements in energy efficiency with the rise in innovation and technology.
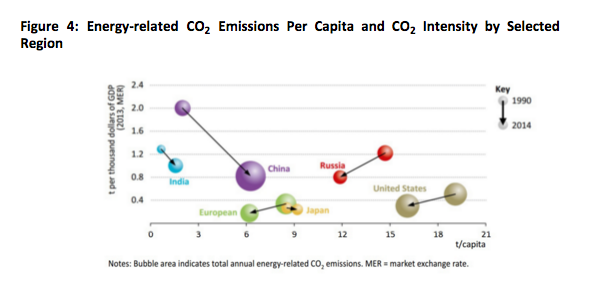
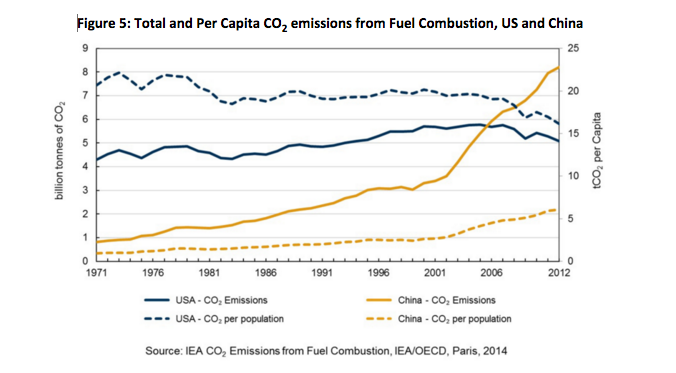
Figure 5 (IEA, 2014) below shows the trend in CO2 emissions in the last four decades between US and China. For the U.S., the level of emissions per capita decreased between 1971 and 1981 and has been steady since then. Total emissions steadily increased between 1971 and mid 2000s before levelling off and partially decreasing. While for China, the total emissions increased between 1971 and 2001 before rising rapidly between 2001 and 2012. Emissions per capita was steady until 2001 but has been increasing since. In the mid 2000s, China surpassed U.S. in terms of total CO2 emissions, however, CO2 emissions per capita for China are still less than 50 percent of the U.S.
China has made some progress in combating some of the problems of climate change. The Chinese government in 2009 had promised to cut carbon intensity by 40 to 45 percent from its 2005 level, by 2020 and Prime Minister Li further announced a new goal to extend the cut to 60-65 percent by 2030. Government data revealed that by the end of 2014, China had reduced carbon intensity by 33.8 percent from its 2005 level, making good on the commitment they made (Buckley, 2015). India has also announced its long-term plan to address global climate change and greenhouse gas emissions. The plan commits to reducing the intensity of fossil fuel emissions 30 to 35 percent from its 2005 level, by 2030, while producing 40 percent of its electricity from non-fossil-fuel sources such as wind, solar power, hydropower and nuclear energy by the same year (Barry and Davenport, 2015). On the international stage, a binding agreement has just passed that sets target levels for greenhouse gas emissions and formulating strategy plans and timelines to achieve those goals. In COP21 that took place in Paris, the U.S. said it would reduce its carbon dioxide (CO₂) emissions as much as 28 percent below 2005 levels by 2025, while China said its emissions would peak no later than 2030.
A new global framework comprising the Sustainable Development Goals, was also passed that addresses the issue of global climate change. This framework, along with other negotiating platforms such as the Green Climate Fund, Financing for Development and World Conference on Disaster Risk Reduction aims to address the allocation of resources, funds or finance packages for developing countries to deal with the consequences of climate change, mitigation actions including details such as the origin of the funds, who will contribute to the funds and who will receive the funds.
As we transition towards more sustainable development, addressing global climate change remains both a challenge and an opportunity. Advanced economies as well as the developing economies need to reevaluate their use of fossil fuels and contributions to greenhouse gas emissions as a means of stimulating economic growth. History has shown that the two are inextricably linked, but as new technologies and better governance emerges, this does not have to be the case going forward.
References
Anthony Fensom, “China, India To Lead World By 2050, Says PwC”. http://thediplomat.com/2015/02/china-india-to-lead-world-by-2050-says-pwc/. (Feb 2015)
Australia Beaten by Bangladesh, Iran as World Economic Leaders in 2050
http://www.pwc.com.au/press-room/2015/world-in-2050-feb15.html
“Carbon Dioxide Emission and Intensity.” Key World Energy Statistics. International Energy
Agency. (Oct. 2010)
Chris Buckley, “China Pledges to Halt Growth of Carbon Emissions in Climate Plan”, http://www.nytimes.com/2015/07/01/world/asia/china-carbon-emissions-climate-change.html?_r=0. (Jun 30, 2015)
Ellen Barry and Coral Davenport, “India Announces Plan to Lower Rate of Greenhouse Gas Emissions”. http://www.nytimes.com/2015/10/02/world/asia/india-announces-plan-to-lower-rate-of-greenhouse-gas-emissions.html. (Oct 1, 2015)
“Energy Consumption and GDP.” Key World Energy Statistics. International Energy Agency.
- Web. 15 Oct. 2010.
European Environment Agency, Data and Maps
International Energy Agency, Graphics
International Energy Agency, Graphics
International Energy Agency, Graphics
International Energy Statistics, U.S. Energy Information Administration
https://www.eia.gov/cfapps/ipdbproject/IEDIndex3.cfm?tid=90&pid=44&aid=8
Joanna Sudgen, “India Leads World Bank Growth Forecast Amid Global Economic Heavy Weather”. http://blogs.wsj.com/indiarealtime/2016/01/08/india-sheltered-from-global-economic-heavy-weather-world-bank-says/http://blogs.wsj.com/indiarealtime/2016/01/08/india-sheltered-from-global-economic-heavy-weather-world-bank-says/ (Jan 2016)