Bicycling is exploding across the United States, and Washington, DC is no exception: the share of bicycle commuters in the District has grown by 315 percent since 1990 and overall ridership rose 80 percent between 2007 and 2010. This growth is tied to the metro area’s commitment to expanding trails and bike lanes and, in large part, to the rapid expansion of Capital Bikeshare.
With a fleet of 2,500 bikes and over 300 stations across the metro region, Capital Bikeshare has been hailed as a resounding success. It’s fun, popular, and can improve public health and reduce pollution. But does it make economic sense?
The fact is that bikeshare programs rarely pay for themselves—they rely heavily on sponsorships or grants to cover the gap between revenues and operating costs. Still, cities around the world are investing in the programs, often with federal funding, suggesting that there are other reasons to invest in urban bikeshare programs.
One reason to be particularly interested in the economic aspect of bikeshare systems is the recent bankruptcy of PBSC Urban Solutions (also known as Bixi), the company that supplies the bikes and equipment for numerous bikeshare systems around the country. Not only does the company owe the city of Montreal $31.6 million in loans, but Chicago and New York have withheld $5.3 million in funding and are requesting damages totaling $11 million to compensate for software problems.
Alta Bikeshare, which operates Capital Bikeshare, has said that Bixi’s bankruptcy will not affect the operation and growth of its bikeshare systems around the country. However, the installation of new stations in College Park and Alexandria are currently on hold due to the bankruptcy.
The Bikesharing Concept
The concept of bikesharing programs in metropolitan areas is not a new one, but only in the last decade have cities developed large-scale, technology-driven programs. In general, the main goals of city bikeshare programs are to make bicycles a part of the city transportation system, promote cycling and a healthy lifestyle, reduce congestion, improve air quality, and increase peoples’ movement around the city.
The idea is simple: users can pay a daily, weekly, monthly, or annual fee to become a member and are then granted access to borrow a bike from any bike station around the city. In the case of Capital Bikeshare, rides of 30 minutes or less are free, with fees charged for additional time.
There are a number of business models currently employed for city bikeshare programs, including non-profit, privately owned and operated, publicly owned and operated, and publicly owned and contractor operated. In North America, user fees, sponsorships, and advertising are the top three sources of revenue. For instance, Citi is the title sponsor of New York City’s recently launched program, contributing $41 million over the next five years.
Preceded by the smaller, failed SmartBike program, Capital Bikeshare launched in September 2010 as a city-wide program jointly owned by the District of Columbia and Arlington County, VA. The City of Alexandria, VA and Montgomery County, MD have since joined. The program is publicly funded, and the private company Alta Bicycle Share, Inc. operates the system in partnership with other companies like Bixi, covering every facet of the program from design and construction to operation and maintenance.
In terms of growth, coverage, and consumer satisfaction, Capital Bikeshare has been a clear success. There are now over 40,000 annual members and, as the graph below shows, around 2,500 bikes in service.
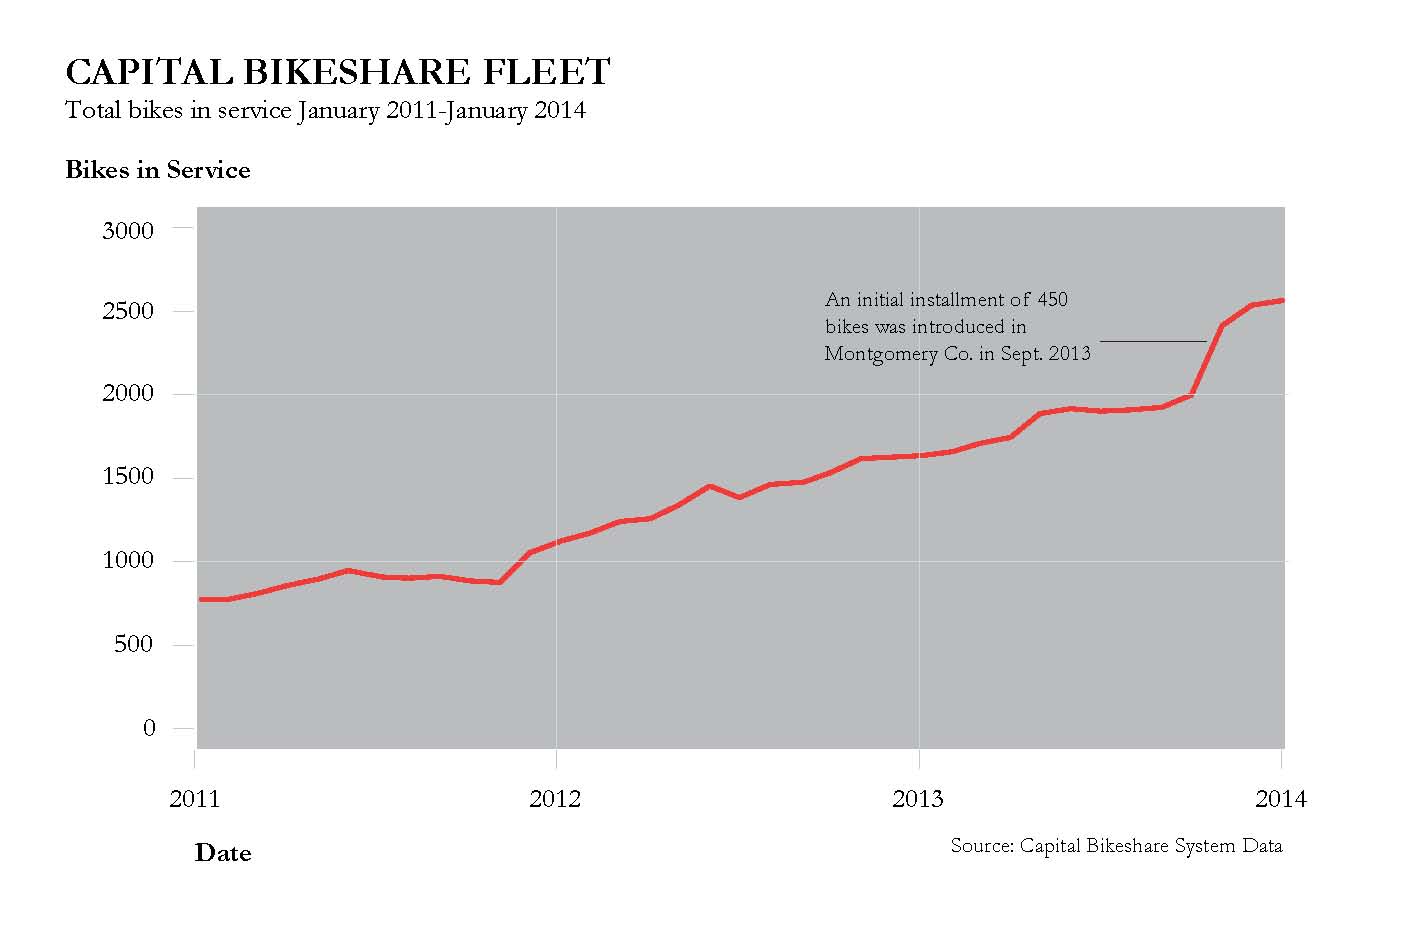
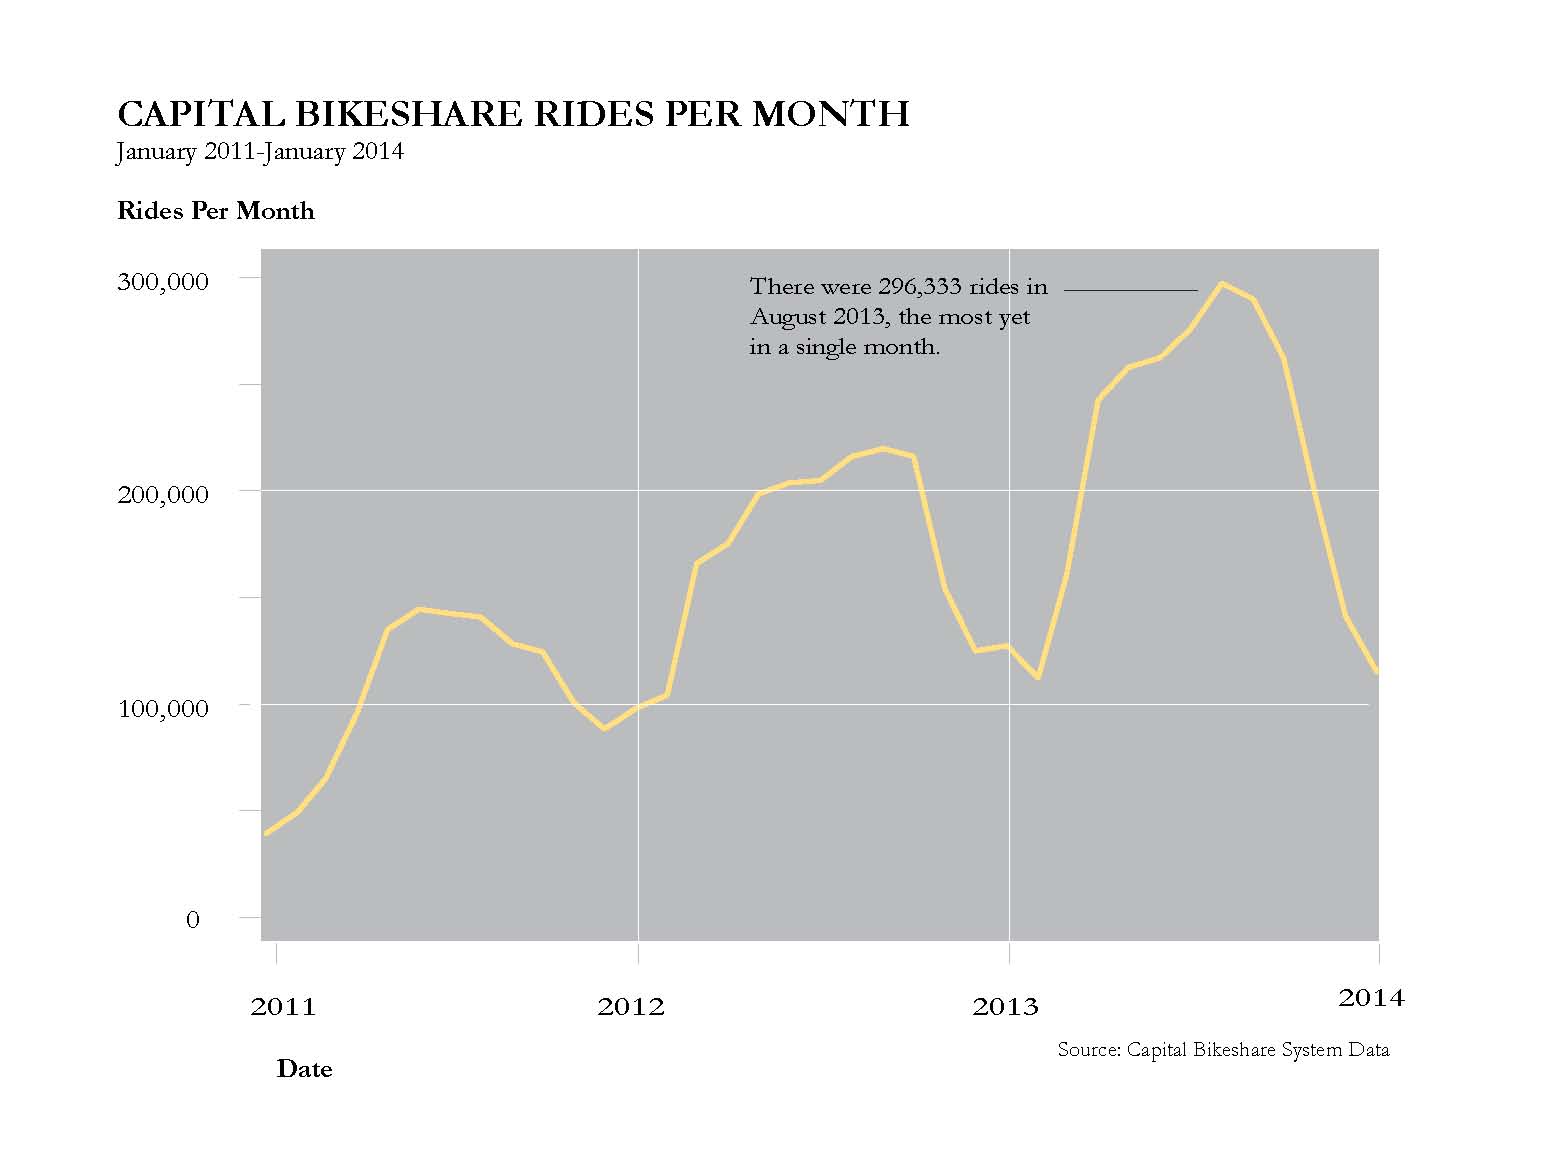
The average number of rides per month has increased steadily over the last three years, with substantial dips during the winter months. Last summer, riders averaged almost 300,000 rides per month. That means that during the peak season, each bike is being used about four times per day.
Costs and Revenues
Compared to other forms of infrastructure and public transportation, bikeshare programs are relatively low cost. Still, they are a sizable investment for cash-strapped city governments. Arlington County’s financial statements and annual reports for Capital Bikeshare are publicly available, providing an excellent source of information on the program’s costs and revenues. Because Arlington County makes up only a share of the total bikeshare system, and because there may be economies of scale, it would be ideal to have financial statements from the District as well. Unfortunately, the information available from the District Department of Transportation does not provide enough detail to be able to disaggregate cost and revenue streams and sources of capital funding. We can assume that costs are similar on a per-station basis across the municipalities, but without detailed financial information, it is impossible to know the exact cost recovery ratio for the Capital Bikeshare system as a whole.
There are numerous capital costs associated with installing new stations, including the stations themselves, bikes, permits, and design plans. Each jurisdiction is then charged a monthly fixed operating cost by Alta. In Arlington this is $107.22 for each dock (with each station comprising 11-27 docks). The fee covers Alta’s operations costs, which come primarily from rebalancing—moving bikes from one station to another to avoid having stations that are either completely full or empty. These contractor fees account for about 80 percent of total operating costs in Arlington. The remaining 20 percent of operating costs come from administration and marketing.
Though Capital Bikeshare has yet to achieve full cost recovery, neither do Metrorail or Metrobus. Arlington receives capital revenue from two sources: a flat $200,000 that comes from the county’s vehicle decal fee, and a grant through the Congestion Mitigation and Air Quality (CMAQ) program, valued at $1.2 million for 2013, and $7.2 million in its entirety. Operating costs are partially covered by farebox revenue (member fees and usage fees), but so far they do not fully cover operating costs. With a 74 percent operating cost recovery ratio, Arlington has projected an operating deficit of $500,000-$600,000 for each of the next several years. The District’s operating deficit in fiscal year 2013 was about $392,000. This compares to an 80 percent cost recovery ratio for Metrorail and 27 percent for Metrobus.
Non-Monetary Costs and Benefits
Given that Capital Bikeshare is neither self-sustaining nor strictly necessary for transporting people around the city like Metrorail or Metrobus, what makes it a good use of government money? A thorough cost-benefit analysis weighing both monetary and non-monetary costs and benefits would provide additional details necessary to make this judgment. Such a study was conducted in 2010 as part of a grant proposal for Capital Bikeshare. Using a 7 percent discount rate, the study projected a benefit-cost ratio of 1.72 over 20 years.
More than three years into the program, it would be useful to revisit the calculations to see what assumptions held true and which were not accurate. Such an exercise would allow city planners to turn anecdotal user information into concrete data for decision-making and financial planning. The section that follows does not attempt to come up with a precise benefit-cost ratio, but rather to explore the nature and economic value of some of the non-monetary benefits of Capital Bikeshare.
Quantifying the Benefits of Bikeshare
Data on the personal and societal benefits of public bikeshares is limited. Most studies that have been done employ user surveys, providing interesting but limited information. Some cities have measured miles of driving replaced, CO2 emission reduction, and number of calories burned. These figures have not been monetized, however, making it hard to fully evaluate the returns to bikeshare programs.
Even seemingly obvious benefits are actually not that obvious. For example, a 2012 report on the health implications of Capital Bikeshare suggests that the benefits are limited since most users are already healthier than the general population. The authors recommend that expanding the program to low-income areas would increase the health impact (more on this later). Further, studies in London, Lyon, and Washington DC have found that only 7 percent of bikeshare users replaced private car use with bike riding, meaning that pollution and congestion reductions are likely to be small.
Still, estimates can be made combining information on user behavior and standard figures for monetizing the outcomes of that behavior. For Capital Bikeshare, user information is available through a November 2012 member survey that contained questions about members’ demographic characteristics, their use of Capital Bikeshare, and their general satisfaction with the program. There is likely to be some bias in the results: it could be that those who responded to the survey (34 percent of those randomly contacted) were more avid users of the system, therefore inflating the results. Even so, the data is useful for giving a general picture of the most significant benefits.
User cost savings: About 67 percent of monthly and annual members reported saving $1-$20 per week, while 17 percent save $21-$40 and 7 percent save more than $40 per week. The average weekly savings was $15.39, resulting in about $370,000 in annual transportation cost savings for the approximately 24,000 members. This does not take into account weekly and daily users, who account for about 20 percent of all trips.
These cost savings come from a reduction in use of other forms of transportation. About 50 percent of survey respondents reported driving a car and taking the bus less often, while about 60 percent said they take fewer taxis and use Metrorail less frequently.
Increased access: Forty percent of respondents had used Capital Bikeshare to make a trip in the past month that they would not have otherwise made. About 25 percent made one or two induced bikeshare trips, 11 percent made between three and five trips, and 5 percent made six or more trips. Monetizing this benefit would require subtracting the user and time costs of bikesharing from the user and time costs of the next cheapest mode of transportation (assumed to be bus transport).
Congestion reduction: In general, Capital Bikeshare members borrow bikes as a replacement for walking or taking public transportation. In fact, over half of the survey respondents do not own a car or have access to one. However, about a quarter of respondents did reduce their annual driving miles between joining the program and taking the survey. The average annual reduction in vehicle miles traveled (VMT) among respondents was 198 miles, for a total reduction of 4.7 million miles driven for the 24,000 members. In the 2010 cost-benefit analysis, a congestion reduction value from the National Highway Traffic Safety Administration was applied in order to calculate the monetary value.
Emissions reduction: Based on the number of miles traveled by users, Arlington County estimates 1.6 million pounds of CO2 reduction in 2013. It is not clear, however, that this takes into account the percentage of trips that replaced car use. Although the member-reported reduction in vehicle middles traveled is significant, more rigorous research is required to determine the actual trade-offs between biking and driving and the resulting environmental impact.
Improved public health: Health benefits are a large side effect of city bikeshare programs. In fiscal year 2013, users traveled almost 2.5 million miles and burned 100 million calories. Over 25 percent of survey respondents indicated that they had lost weight and felt healthier since joining Capital Bikeshare. The economic value of these health benefits would require calculations including the estimated health status of the users and the likely reduction in health care costs from a more active lifestyle. Such a study conducted in Portland, Oregon, found that significant investments in bicycling infrastructure could, over the next 30 years, have health care cost savings of $400-$600 million.
Car accident reduction: With fewer cars on the road, the number of accidents between cars decreases. An estimate of the number of car accidents avoided can be calculated using the reduction in vehicle miles traveled per user and the average number of the accidents per vehicle mile traveled.
Though car-only accidents may decrease, accidents involving bicycles are likely to increase with more bikers on the road, and this could be seen as an additional cost of the program. As of March 2013, there had been 88 reported crashes involving Capital Bikeshare cyclists, none fatal. Important to this discussion is the fact that a significant percentage of Capital Bikeshare users do not wear helmets. A 2012 study by Georgetown University found that only 33.1 percent of Capital Bikeshare commuters wore helmets, compared to 70.8 percent of commuters on privately owned bicycles.
The increase in bike accidents might not be as large as expected, however, considering that the presence of Capital Bikeshare has prompted the expansion of bike lanes and the creation of cycle track lanes on some main roads in the District. A recent study in Canada found that bicyclists using cycle tracks had one ninth the risk of an accident as those riding on a street with parked cars and no bike lanes. In comparison, those riding on a street with bike lanes and no parked cars had half the risk of an accident. There is also some evidence of “safety in numbers”—drivers become more aware and cautious knowing that there are more bicyclists on the road.
Reduced travel time: One the biggest uses of Capital Bikeshare is as a first and last mile of workers’ commutes—many users ride from their home residential area to the nearest metro station as a way of shortening their commute. The monetary benefit would depend on the measure used for the value of time.
The Benefits of More Research
Despite the fact that Capital Bikeshare has not yet achieved full cost recovery, its proponents argue that it is a part of the public transportation system just like Metrorail and Metrobus, and as such should not be expected to fully pay for itself. If that is truly the case—if cities around the country continue to add bikeshare programs and treat them as key components of their transit system—it will become even more important to rigorously collect data on the various costs and benefits associated with bikeshares.
Much of the bikeshare research that exists today focuses on planning and how systems should be designed in order to succeed. I propose taking this research a step further by looking closely at the different costs and benefits that make up the full economic picture of bikeshare programs.
Capital Bikeshare has made important steps in collecting information through conducting member surveys and recording actual system data, but more could still be done. For instance, modeling the demand curves of Capital Bikeshare members and casual users would provide information on how they value additional trips made on bike, and how likely they are to replace other modes of transportation with bicycling. This data would, in turn, allow for more accurate estimates of pollution reduction and health benefits. All of these figures are important sources of information as the metropolitan region considers how to expand Capital Bikeshare and how to adjust the current transportation system to accommodate the growing network of bicycle stations.
The second part of this series will consider an issue not covered in a cost-benefit analysis: how well Capital Bikeshare is reaching low-income neighborhoods and whether or not it has a mandate to do so.
6 comments
So, where is the follow-up story on how well Capital Bikeshare is reaching low-income neighborhoods and whether or not it has a mandate to do so?
[…] City planners love it because it’s a relatively inexpensive way to provide mobility for people to get around. It is very space efficient and energy efficient. And you can get a system up and running very quickly. It generally takes about two years to plan, prepare, and launch a system, which is much shorter than new bus or rail transit. So systems are popping up across the country very quickly. […]
[…] a previous article I discussed the monetary and non-monetary costs and benefits of Capital Bikeshare, and how more […]
[…] is that the economics of bicycling is still not understood: As Kristine Johnson explains in the Georgetown Public Policy Review, we need to know more about the economic benefits of bicycling. Fair or not, cycling and its […]
[…] support, so this DC partnership is incredibly groundbreaking. NYC's Citibank sponsored program mirrors other cities relying heavily on sponsorships and grants to cover operating costs. Is it possible that outside […]
[…] so this DC partnership is incredibly groundbreaking. NYC’s Citibank sponsored program mirrors other cities relying heavily on sponsorships and grants to cover operating costs. Is it possible that outside […]
Comments are closed.