Original research demonstrates that while the Republican Party has a great deal to gain from successful bipartisan immigration reform, House Democrats face little benefit and even, paradoxically, the possibility of significant losses.
By Alex Engler
–Click to Enlarge Any Image–
The newest iteration of the Senate’s worst naming convention, the Gang of 8, has come forward with a general blueprint for comprehensive immigration reform. Last week Senator John McCain (R-AZ) said he was “cautiously optimistic” about the prospects of a hypothetical bill passing through the House of Representatives.
The Senator’s prudence is warranted. Along with the late Senator Ted Kennedy (D-MA), McCain co-sponsored the 2007 immigration reform bill that failed to pass the Senate. Even if legislation can navigate through the Senate this time around, the House is a taller hurdle. The House Judiciary Committee just held its first hearing of the new Congress on immigration issues—a hearing in which Republican members painted a pathway to citizenship for illegal immigrants as equally as extreme as mass deportation.
Yet, the United States population is now 16.7 percent Hispanic, according to the most recent Census Bureau data. Of that population, 82 percent support a path to citizenship. These are demographics that the Republican Party cannot afford to ignore, not because of what they have to lose, but because of what they stand to gain.
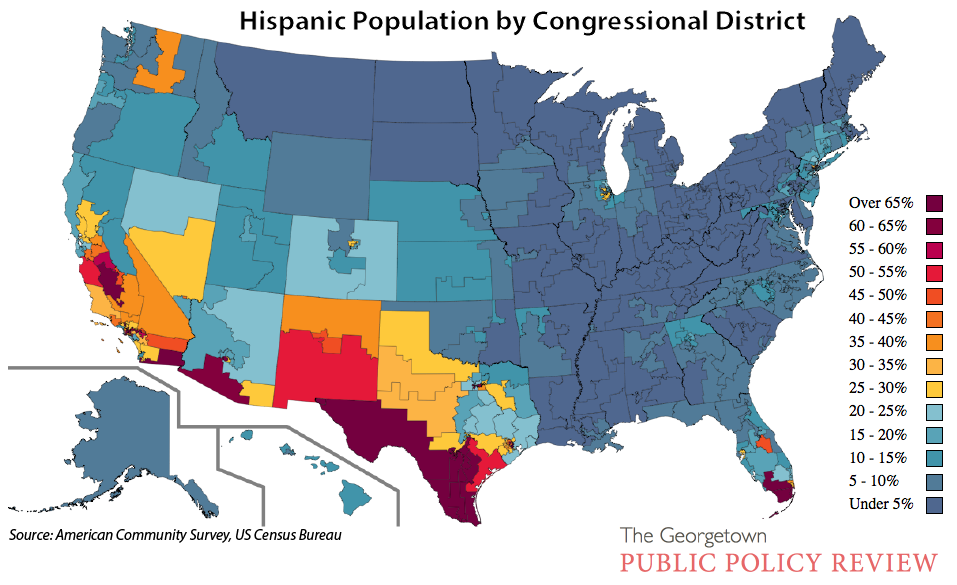
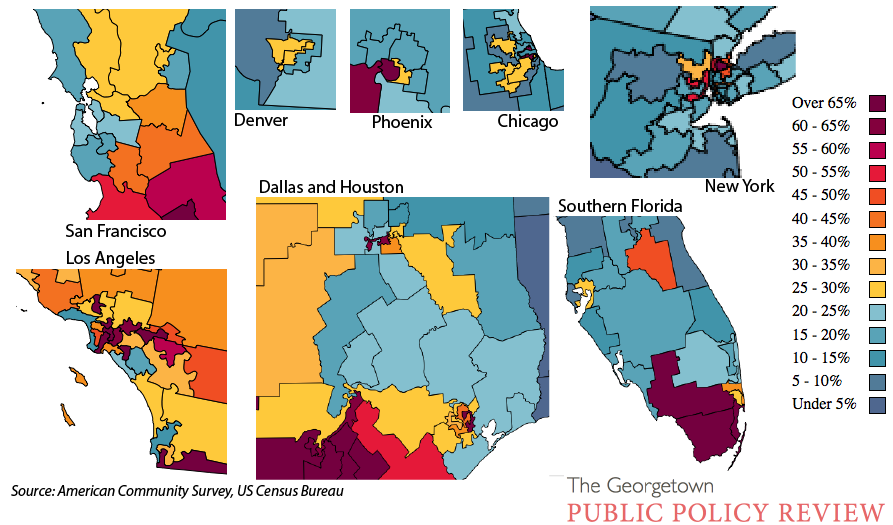
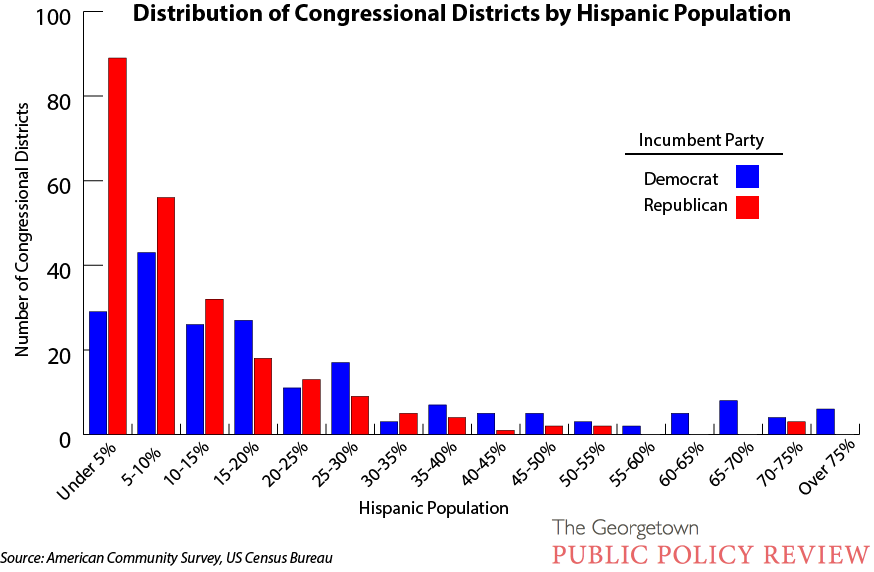
Democrats currently control the majority of districts with large Hispanic populations. There are 39 Republican districts that are more than 20 percent Hispanic, and only five that are more than 50 percent Hispanic (compared to Democrats’ 76 and 28 districts, respectively). The map at the top of this article gives a general snapshot of where these districts are located. However, given the advantages of incumbency and the significant influence of gerrymandering, this information alone is not sufficient to inform how immigration reform might fare.
Taking the competitiveness of the House races into consideration puts these figures into a more meaningful context. By comparing the margin of victory across congressional races (total Republican votes minus total Democratic votes) to the estimated Hispanic vote of those districts, the relative influence of this group becomes more clear.
Unfortunately, there is no reliable information on Hispanic voter turnout in 2012. Due to this dearth of hard numbers, it is necessary to make some assumptions. Nationally, about 42 percent of all Americans turned out to vote in the 2012 election, but the Hispanic population is younger and contains more individuals ineligible to vote. Looking forward, however, it is also important to consider that Hispanics account for more than half of the United States’ population growth.
Using three different levels (42, 35, and 30 percent) of Hispanic voter turnout to account for this uncertainty, this article analyzes how shifting Hispanic support would have affected House races in 2012.
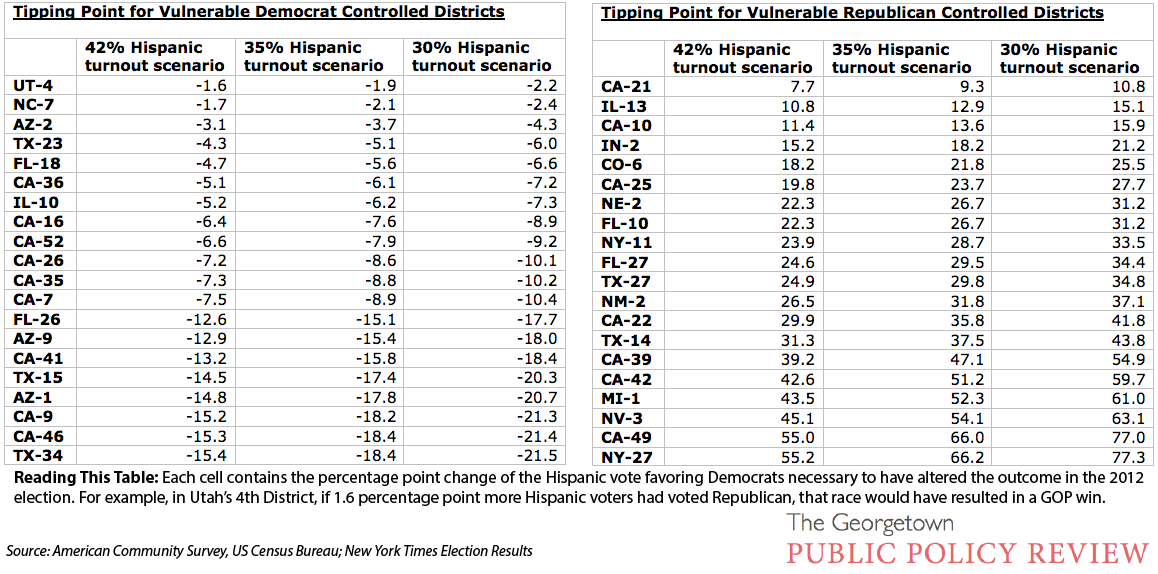
The following tables (click to enlarge) demonstrate the shifts in Hispanic voting that would have been necessary to produce a victory for the losing side in the 2012 election under the three turnout projections. The 20 congressional districts that make up each table are the most vulnerable for each party in terms of shifts in the Hispanic vote.
Based on this data, a dramatic shift in Hispanic support toward Democrats would have yielded startlingly small gains in the House. Under the 42 percent Hispanic voting scenario, a 10 percentage point shift toward Democrats would net only one additional seat, and a 20 percentage point shift would turn only six seats.
Conversely, shifts away from Democrats by Hispanics could be devastating. Under the 42 percent scenario, a 5 percentage point shift toward the GOP would have turned five races into Republican victories. A 10 percentage point shift to the right would have handed Republicans 12 seats, and a 16 percentage point shift would have flipped 21 districts. Using the lower turnout models reduces the number of seats changing hands, but the narrative remains the same.
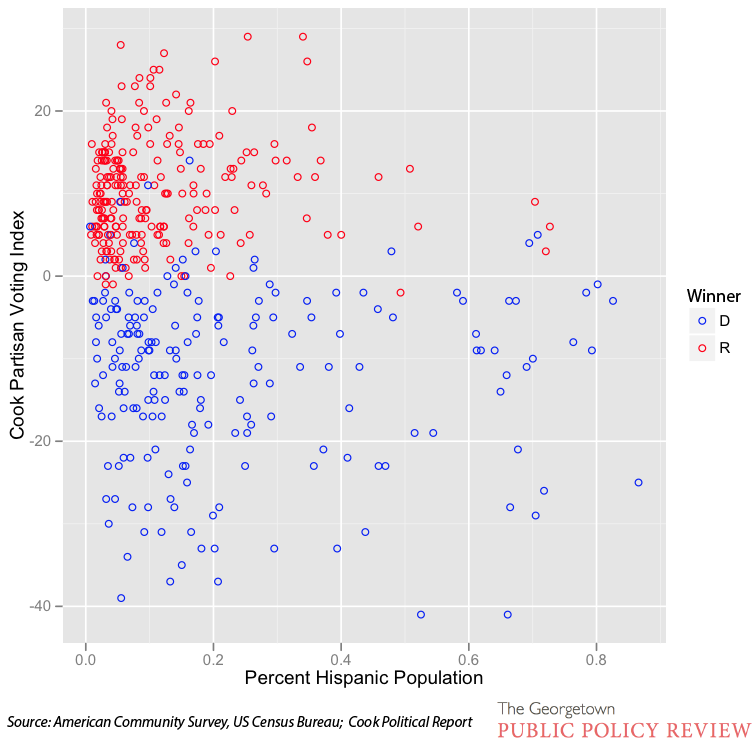
The story is similar when using a different metric of district competitiveness as well. The Cook Political Report’s Partisan Voting Index (PVI) measures how each district leans in terms of party affiliation, with zero indicating a balanced district. In this scatter plot, higher PVI indicates a stronger identification with the Republican Party in that district.
Looking at the right side of the graph (high Hispanic population), blue dots outnumber their red counterparts near the horizontal axis (PVI=0). This reaffirms what the data has shown so far. There are many more competitive races in heavily Hispanic areas for Democrats to lose than to gain.
These figures should put Democratic strategists on edge. Many of their victories appear to be heavily dependent on a demographic that leans—by some 82 percent—on one side of a contentious immigration issue. Given such numbers, Democratic political operators must know that a bipartisan compromise on immigration reform might derail any attempt to retake the House if it allows the GOP to gain even a little ground with Hispanics. In addition, there is undoubtedly a substantial group of incumbents who hope to keep this issue in play in order to aid in their own reelection campaigns.
There are two different lenses through which to consider the Republican perspective. First, most incumbent Republicans will not have a strong incentive to vote for an immigration bill containing a path to citizenship if a significant Hispanic population appears to be lacking in their districts. In fact, many conservatives may be far more concerned about primary challengers than Hispanic backlash.
On the other hand, the Republican Party as a whole has a tremendous opportunity to turn districts in their favor. If they can redefine themselves to the Hispanic population, starting with comprehensive immigration reform, they will be doing more than pouring water on the DCCC’s gunpowder—they will be stealing it for themselves.
Established in 1995, the Georgetown Public Policy Review is the McCourt School of Public Policy’s nonpartisan, graduate student-run publication. Our mission is to provide an outlet for innovative new thinkers and established policymakers to offer perspectives on the politics and policies that shape our nation and our world.

The American people say NO to amnesty. Either party can gain support of the public by coming out in favor of the rule of law.
Any republicans who think support for amnesty will benefit them politically are completely ignorant of reality. McCain dedicated his entire political capital to amnesty, and 2/3 of the Latino vote went to Obama, who had no record on immigration.
This analysis presumes that the existing base of Republican voters, especially primary voters, will not notice or care about these immigration votes. That’s a big assumption. In many of these safe House districts, the fear is more of a primary challenge than a general election challenge.
This analysis presumes that the existing base of Republican voters, especially primary voters, will not notice or care about these immigration votes. That’s a big assumption. In many of these safe House districts, the fear is more of a primary challenge than a general election challenge.
Kman – You’re certainly right, I actually specifically cite that as a possibility in the last sentence of the second to last paragraph, though it may have warranted more discussion.
Tim – The most recent Gallup poll, as well as others, shows a path to citizenship (which is a step further than amnesty) garnering over 70% approval. Food for thought: http://www.policymic.com/articles/25257/immigration-reform-poll-finds-majority-want-it-regardless-of-political-affiliation
Excellent analysis, Alex. One note about the chart: CA-35 is a heavily Democratic district (67-30 Obama in 2012; 64-34 Obama in 2008) that pitted an Dem Congressman against a Dem challenger. It doesn’t make sense to assume the incumbent Democrat’s vote share as a Republican baseline.
Did you run the numbers for CA-31? A Republican state senator faced the Republican incumbent in November due to a flukish June primary outcome. This 49% Hispanic district s now a top DCCC target. Rep. Miller would definitely benefit from a higher Hispanic vote share in 2014.
Hey Gil, thanks for the feedback. About CA-35, I sort of knew there were going to be a few exceptions like that, but given the scope of the data set, I didn’t have a good way to correct for that outside of through the races individually. Thanks for pointing that out.
On the CA-31: Races that weren’t Republican v. Democrat (either an independent was running or the race was uncontested) were excluded.
This is almost comical. Republicans can gain a few House seats by giving Democrats millions more voters in the swing states of North Carolina, Florida, Georgia, and Virginia. All Republicans have to do is improve their standing by 10 percentage points.
Why don’t we see what 2016 will look like with ten million new voters? That’s a rhetorical question. We don’t see it because Nate Silver and the liberal establishment do not want to show how much Democrats will gain.
Bill, the emerging bipartisan immigration reform framework does not call for immediate amnesty. The process will take years and not all undocumented immigrants will qualify for earned citizenship. Even if all 11 million undocumented people qualified as citizens, not all are in NC, FL, GA, VA, fewer will actually vote, and even fewer still will vote for Democrats.
It’s also worth noting that group voting behavior is not static. Republicans feared the Irish Catholic vote after 1960 — decades later, as they assimilated and their social identity became less bound in religion, Irish Catholics emerged as key swing group. Another fun example: Alaska and Hawaii became states the same year because each party feared the other gaining a partisan advantage — Hawaii, of course, was a Republican stronghold, and Alaska was a Democratic bastion.
There are enough illegal immigrants that will qualify for citizenship to tip the balance in swing states like Florida and North Carolina. There are 750,000 illegal immigrants in Florida alone. North Carolina would have went for Obama if only half the illegal immigrants were given amnesty. I feel safe betting that the majority of them will vote for Democrats. In fact, they will vote for Democrats at a rate higher rate than the national Hispanic average since no Cubans are included in the illegal immigrant population
It just seems odd to focus on a small gain for the Republicans in the House, which they already control, when they stand to lose so much in national elections.
Looking at the first three California districts in the column on the right (21, 10, and 25), in all three cases, Republicans won their House seats in 2012 for idiosyncratic reasons and margins of victory don’t really reflect vulnerabilities of those seats.
In 21, Democrats screwed up by picking an unpopular candidate who didn’t even live in the district, lost the fundraising competition 10:1, and only got half of the votes of all registered Democrats. This is a brand new district and registered Democrats outnumber registered Republicans there 145 to 100. Loss of the seat in 2012 was like a one-off event.
In 10, Democrats likewise have an edge (albeit small, 1%) in registrations. The election pitted an experienced local politician with a 10-year career in the State Senate against an astronaut who lived in Houston most of the preceding decade. The politician won by a 5% margin.
In 25, Republicans have a 4% edge in registrations that was compounded by the fact that the Republican incumbent candidate was a well-liked local politician who represented the district in the House continuously since 1993. He won by a 10% margin.
In the first two cases, saying that Democrats face “little benefit” simply because they would not have won those district even with 42% nationwide Hispanic turnout, seems unjustified. These are properly labeled as a blue district and a swing district that would be “bluer” if there were more Hispanic voters around.
In the third case (and more generally, for all other districts), the question to be asked is, how would increased Hispanic voting eligibility affect voter registration balance? That is a hard question, data on voter registration vs. demographics at the congressional district level does not seem to be available. However, I did find that CD25 is 45.8% white / 8% black / 7.7% asian / 35.3% hispanic (in terms of total population) and its latest voter registration figures are 35.41% Dem, 39.42% Rep. Now, there are many unknowns here and I have to make assumptions, but, assuming that 38% of Hispanics and 24% of other races in the district are under 18, and plugging in reasonable party identification rates, I find that, even if CD25 whites are unusually conservative (30%/60%/10% Dem/Rep/other), current registration figures can only be reproduced if the Hispanic vote in the district is heavily suppressed, with fewer than 40% of all Hispanic adults registered to vote.
The question originally asked by the article was, what would the results of the election look like if adult Hispanics were as likely to vote as an average citizen? In this district, removing the suppression completely reverses the pattern, going from 35% Dem / 39% Rep to 39% Dem / 36% Rep. That by itself turns the district lean-Democratic, without any additional changes in Hispanic vote. Furthermore, while this change would not have been sufficient for Dems to take CD25 in 2012, the claim that Dems needed a 20% shift in the Hispanic vote to take it (on top of full turnout) appears to be unsupported.
Under the Voting Rights Act of 1982, numerous House districts are gerrymandered to be majority minority, which means that most Hispanics and blacks are rounded up into super-Democratic districts. The Republicans like this because it helps Republicans win the more marginal districts and encourages nonwhite Democratic politicians to start their careers as race men, more Bobby Rush than Barack Obama, who thus later have a hard time winning state-wide office.
However, that’s all small potatoes compared to the GOP losing Texas’s Electoral Votes and thus ending the Republican Party’s chances to win the White House.