By Alex Engler
Congressional apportionment, the process by which Members of the House of Representatives are distributed among the states, affects every corner of federal policy. Whether it’s the Sun Belt’s water policy or the Rust Belt’s tax credits, geography defines politics. How a nation is changing—not just in its population but also in its representation—is worth keeping an eye on.
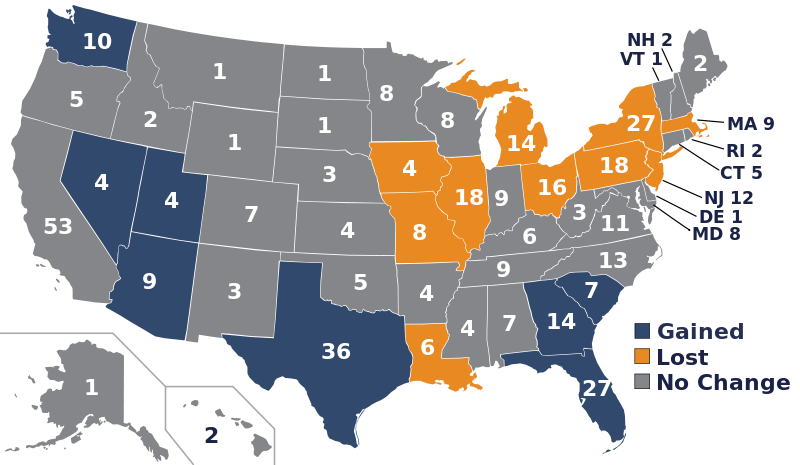
The number of seats in the House of Representatives has been set at 435* since the Apportionment Act of 1911, but where these seats have been apportioned has changed quite a bit over the last century. During this period there have been 202 seat transfers, for an average of 22.4 following each decennial census.
(Click to Enlarge Any Image)
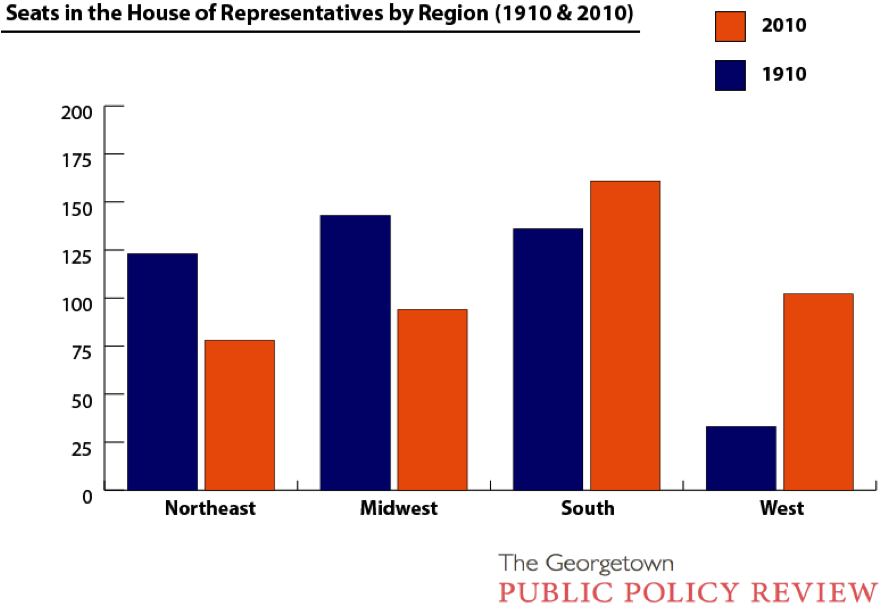
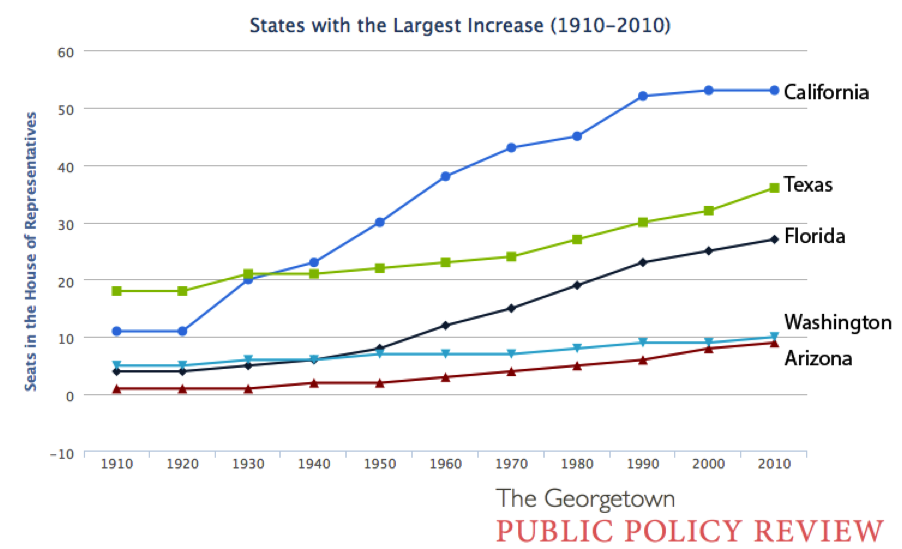
It should not come as much of a shock that the Northeast and Midwest lost out the most, while the western states—led by California—tripled their representation in the lower chamber. Just three states (California, Texas and Florida) saw 69 percent of all the seats gained over the last century.
Alternatively, Pennsylvania and New York have been hit the hardest, losing 18 and 16 seats respectively.
(Click to Enlarge Any Image)
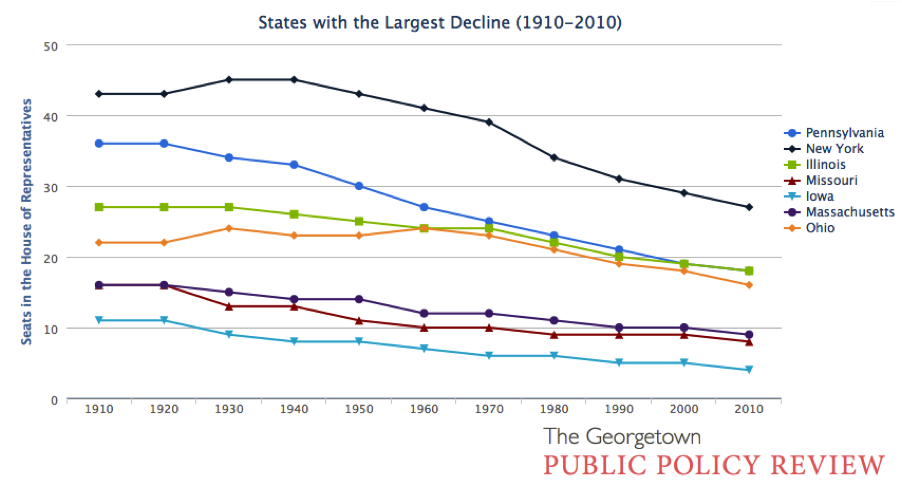
As you can see in the two charts above, there were no changes in apportionment between 1910 and 1920. This was not because the population of the nation stayed stagnant, but instead because at this point apportionment was still not automatic and rural politicians who were losing ground in an urbanizing country successfully blocked apportionment legislation. It was not until 1940 that legislation was passed that automated the apportionment process such that no Congressional action was required. One year later, in 1941, the methodology for calculating congressional apportionment was altered slightly to use the Huntington-Hill/Equal Proportions Method, and the apportionment process has not been changed since.
*There was a brief period when Hawaii and Alaska were first granted Representatives in the House, placing the total at 437. This lasted for four years until the next apportionment in 1963.
Established in 1995, the Georgetown Public Policy Review is the McCourt School of Public Policy’s nonpartisan, graduate student-run publication. Our mission is to provide an outlet for innovative new thinkers and established policymakers to offer perspectives on the politics and policies that shape our nation and our world.